Tracking Your UCAT Progress: Graphs and Statistics

5 years ago by Robert
MedEntry has developed a sophisticated series of graphs enabling you to see how your performance in full-length UCAT practice exams has changed over time. You can access them on the Simulate page of the online UCAT platform:
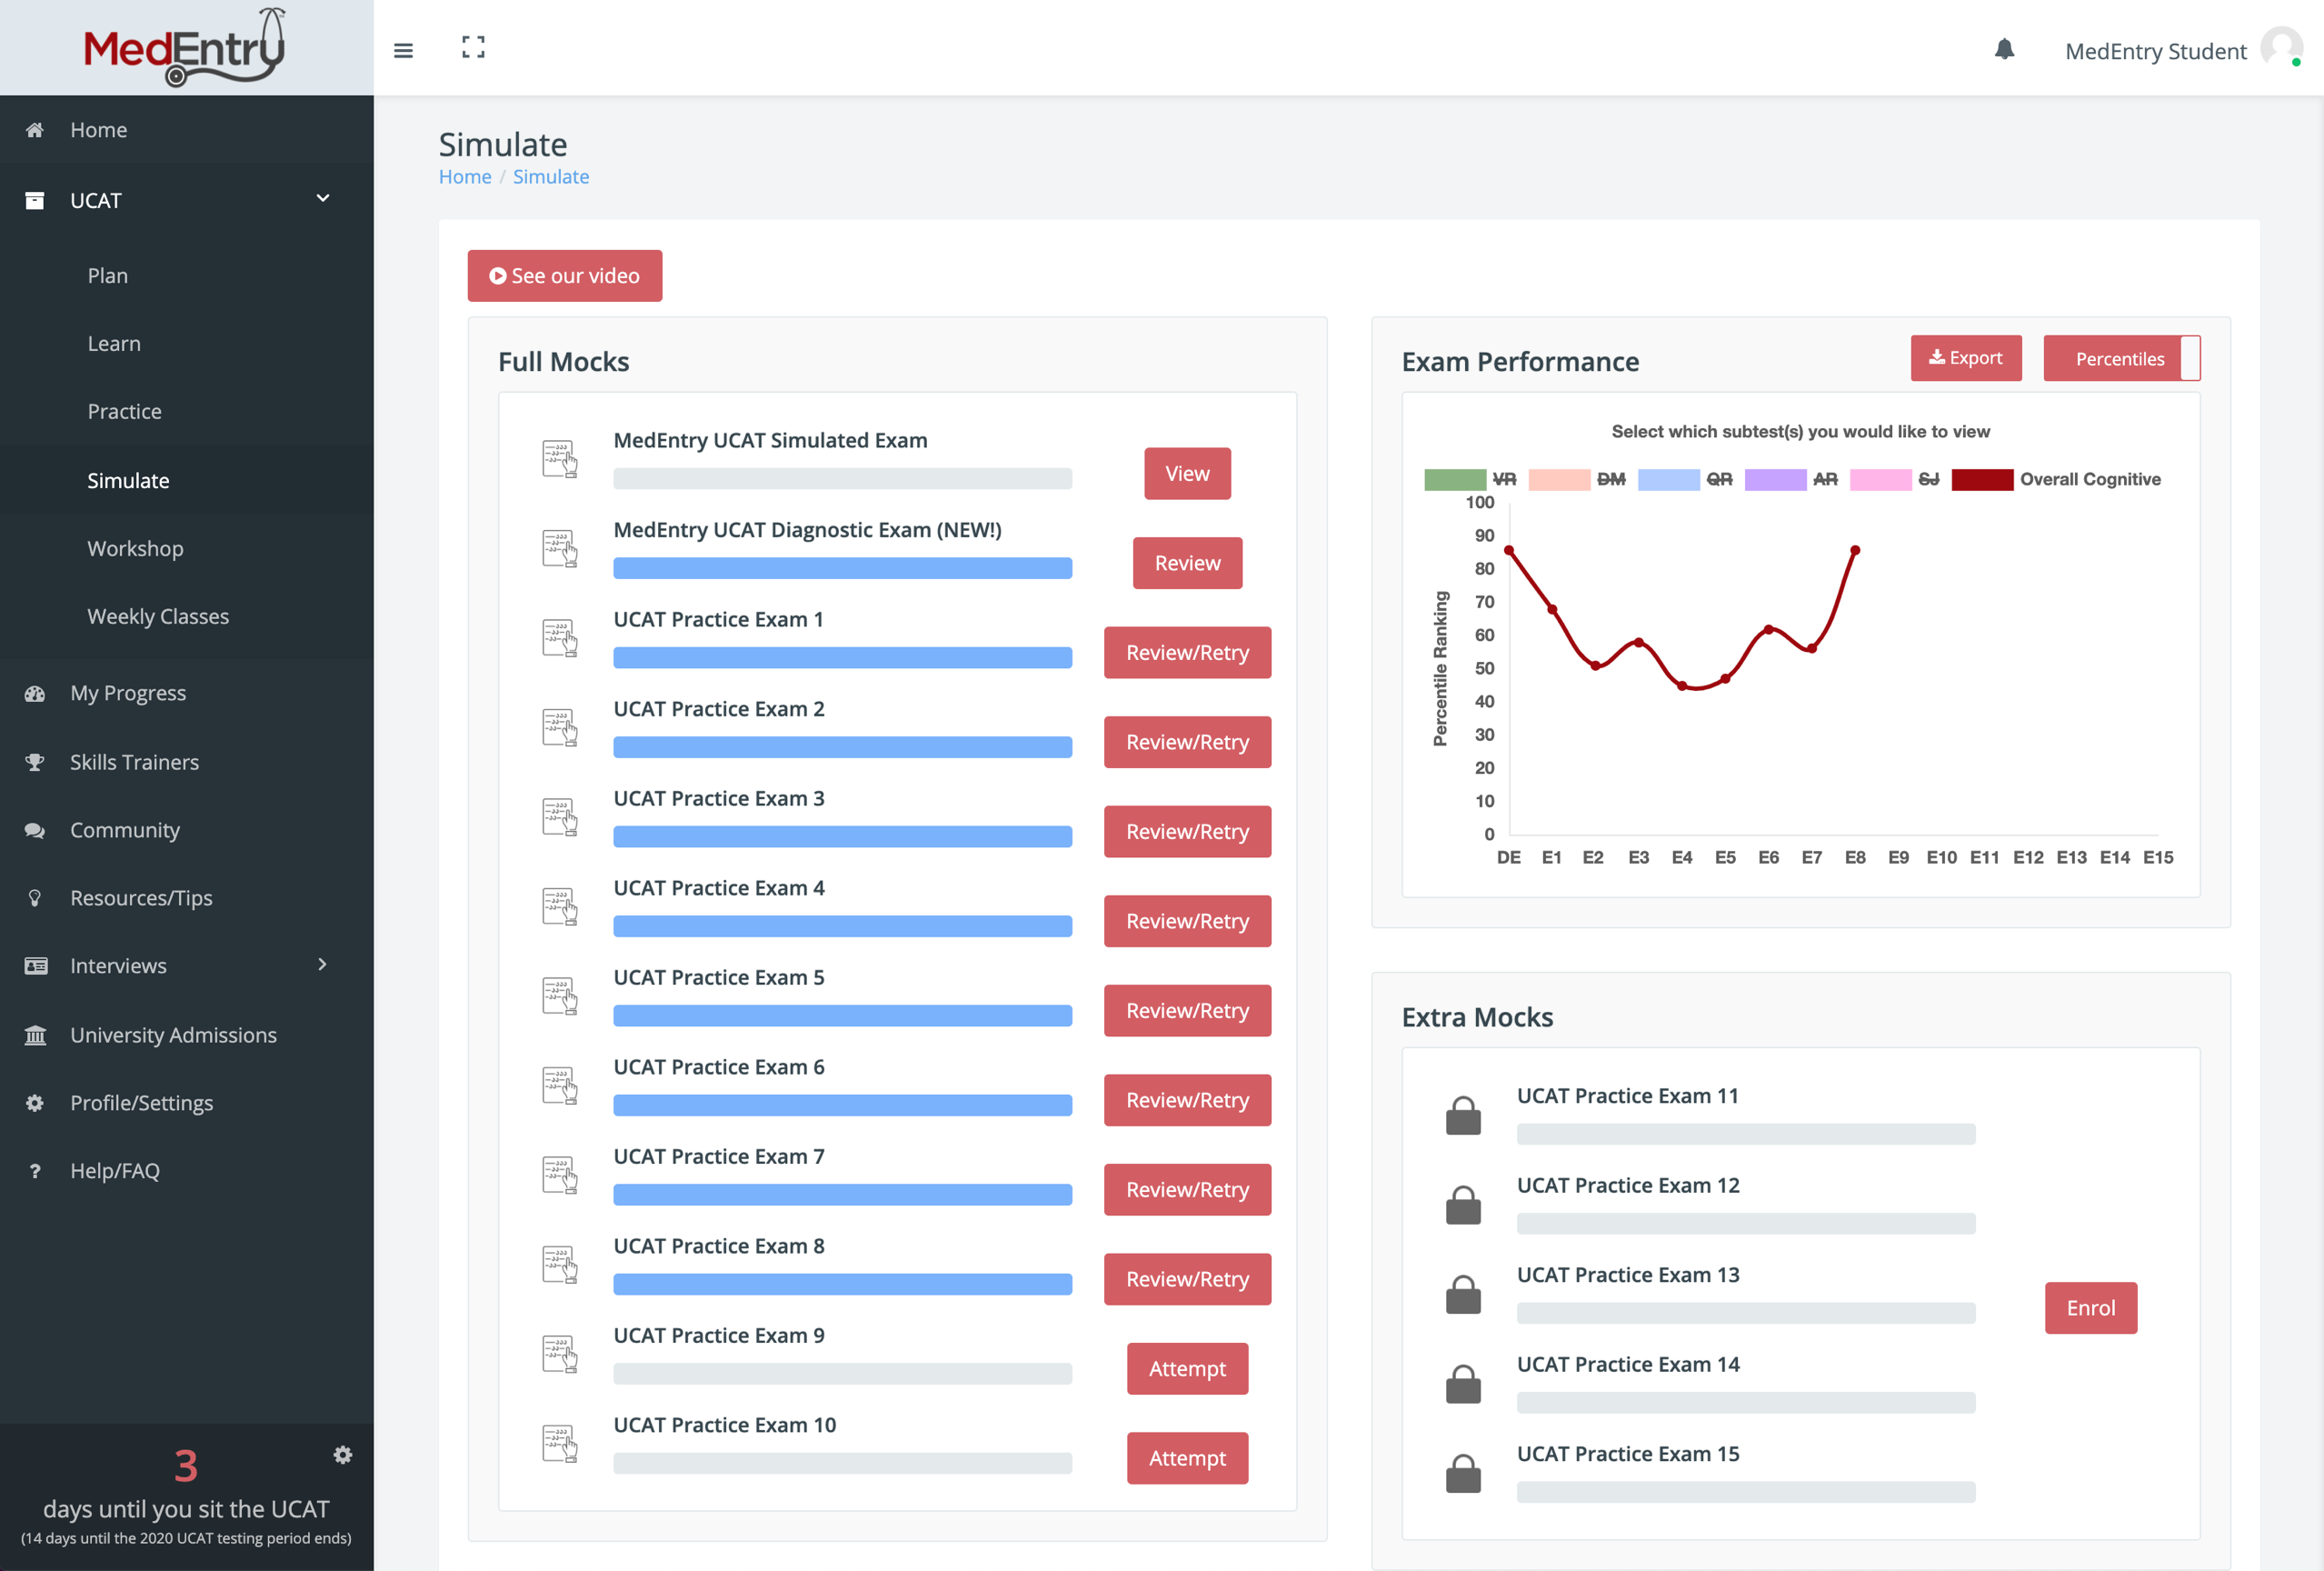
The graph has two modes:
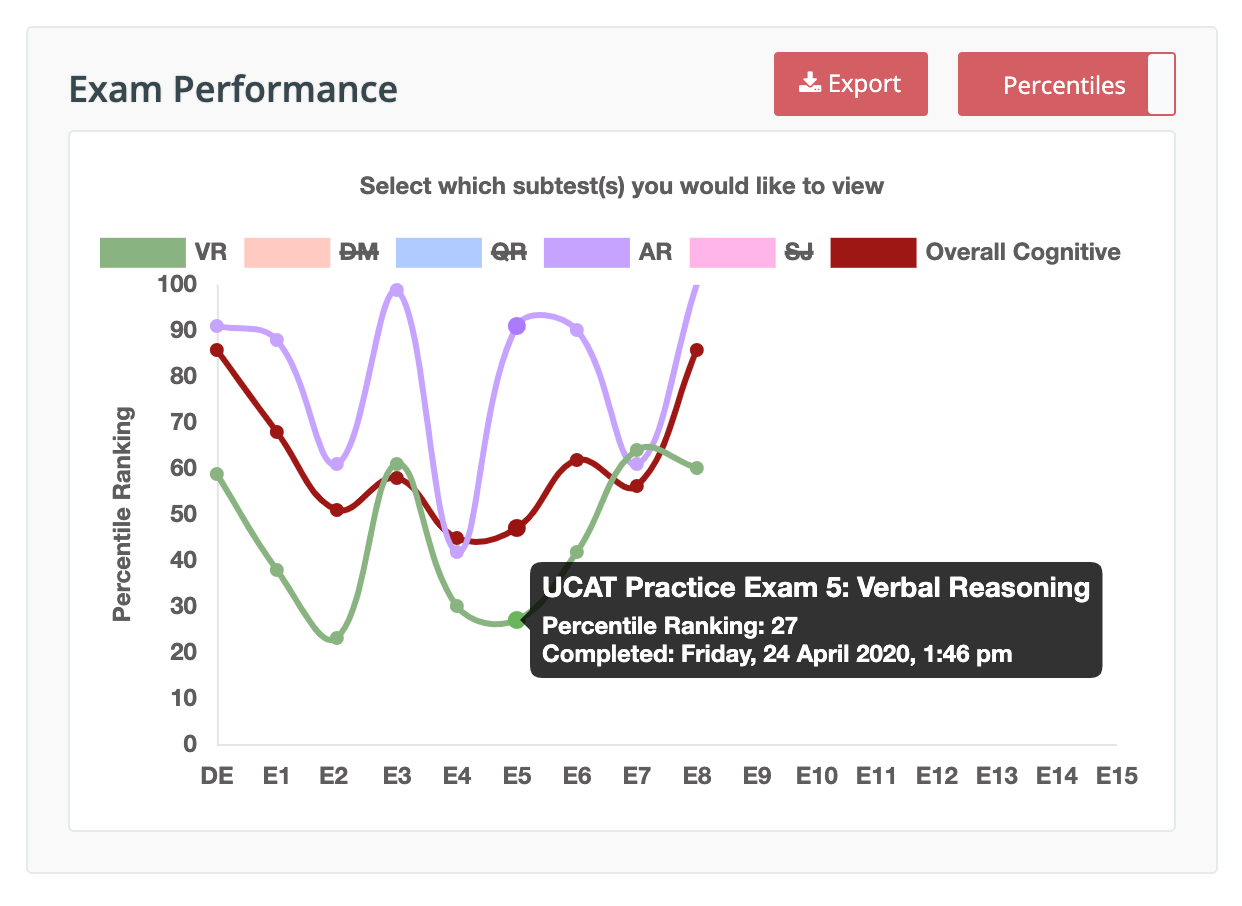
UCAT Percentile Rankings:
This graph displays your overall cognitive percentile ranking for each UCAT exam you have completed. There is an option to hide/show your percentile rankings for each individual UCAT subtest:
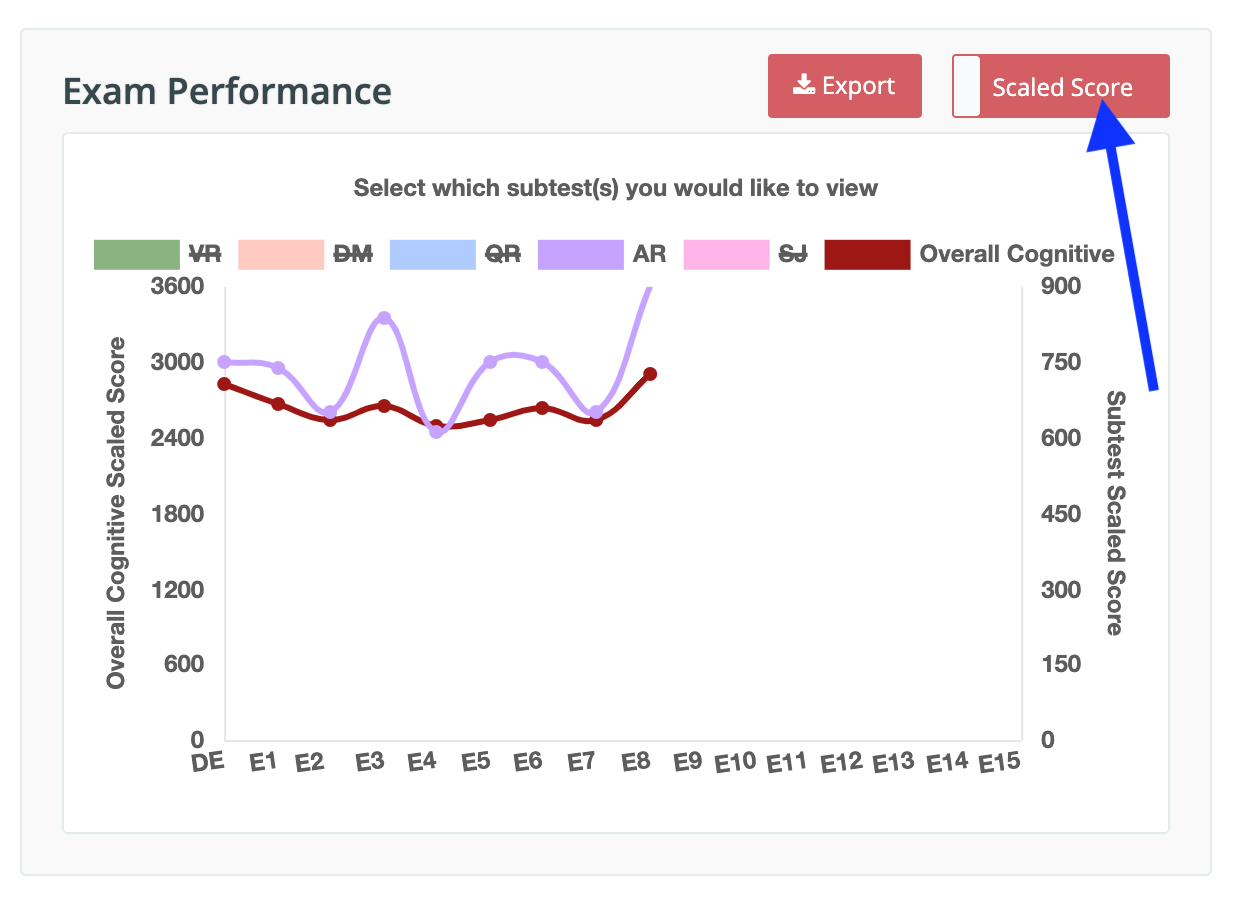
UCAT Scaled Scores:
The graph can be switched to Scaled Scores mode by clicking the switch in the top right:
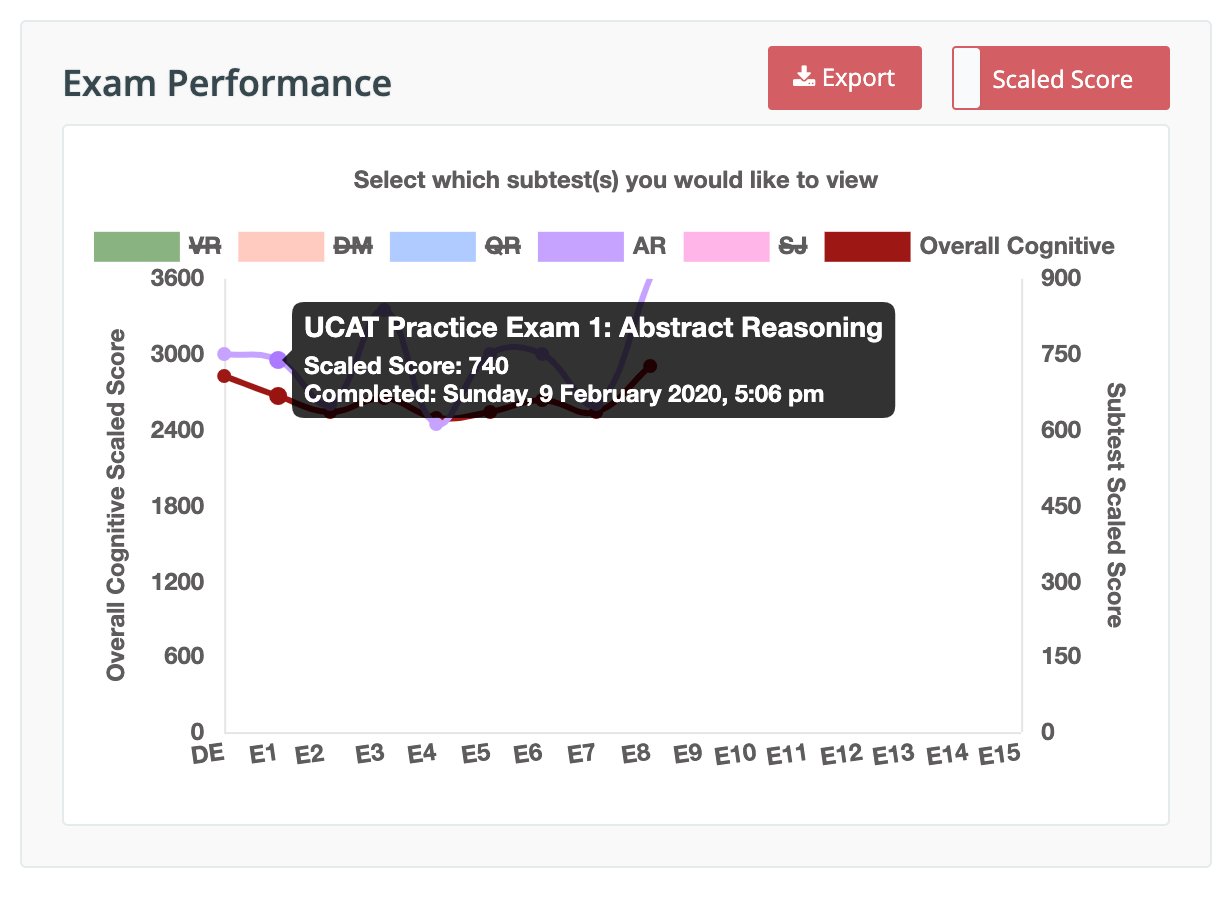
Like the percentile rankings graph, you can hover over any completed exam to see more information:
Export to Spreadsheet:
Many of our students have found it useful to track their UCAT Practice Exam results in a spreadsheet. In order to help you save time, MedEntry has created an export feature, which will export all of your completed UCAT exam results to an Excel spreadsheet:


The spreadsheet includes all of your UCAT exam attempts, with raw scores, estimated UCAT scaled scores and percentile rankings – both for each UCAT subtest and the entire cognitive component.
Just another way MedEntry provides comprehensive feedback for our students.
![]()
![]()